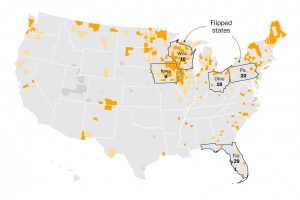
Presidential Election Results, Cape and Islands

They hate women in Bourne.

Town Clinton/Kaine (D) Johnson/Weld (L) Stein/Baraka (G-R) Trump/Pence (R) Write-in
Barnstable 12862 1605 360 10658 937
Bourne 4782 440 122 5157 188
Brewster 3813 296 11 2370 95
Chatham 2395 215 68 1796 86
Dennis 4887 372 138 3751
Eastham 2203 134 61 1198 55
Falmouth 11107 713 264 7055
Harwich 4530 340 129 3290 124
Mashpee 4448 347 119 3839 75
Orleans 2650 190 62 1502 81
Provincetown 2082 38 35 208 18
Sandwich 5958 508 139 5836 209
Truro 1095 62 33 361 0
Wellfleet 1547 73 73 515
Yarmouth 7238 535 189 5813
Aquinnah 231 6 7 34 5
Chilmark 617 30 22 94 10
Edgartown 1786 99 53 779
Gosnold 36 2 0 27 3
Oak Bluffs 2080 87 44 737 42
Tisbury 1942 72 83 476
West Tisbury 1688 70 49 329 17
Nantucket 4144 260 108 1892 102

Total 84121 6494 2169 57717 2047
Percentage 55.00% 4.00% 1.00% 38.00% 1.00%

Interesting Charts – #2 – CNN Exit Polls

national

president


national president

view as

table
graph
clinton
trump
other/no answer

all exit polls

gender

clinton
trump
other/no answer
male

48%
41% 53% 6%
female

52%
54% 42% 4%

age

clinton
trump
other/no answer
18-29

19%
55% 37% 8%
30-44

25%
50% 42% 8%
45-64

40%
44% 53% 3%
65 and older

15%
45% 53% 2%

age

clinton
trump
other/no answer
18-24

10%
56% 35% 9%
25-29

9%
53% 39% 8%
30-39

17%
51% 40% 9%
40-49

19%
46% 50% 4%
50-64

30%
44% 53% 3%
65 and older

15%
45% 53% 2%

age

clinton
trump
other/no answer
18-44

44%
52% 40% 8%
45 and older

56%
44% 53% 3%

race

clinton
trump
other/no answer
white

70%
37% 58% 5%
black

12%
88% 8% 4%
latino

11%
65% 29% 6%
asian

4%
65% 29% 6%
other race

3%
56% 37% 7%

race

clinton
trump
other/no answer
white

70%
37% 58% 5%
non-white

30%
74% 21% 5%

race and gender

clinton
trump
other/no answer
white men

34%
31% 63% 6%
white women

37%
43% 53% 4%
black men

5%
80% 13% 7%
black women

7%
94% 4% 2%
latino men

5%
62% 33% 5%
latino women

6%
68% 26% 6%
others

6%
61% 32% 7%

age by race

clinton
trump
other/no answer
whites 18-29

12%
43% 48% 9%
latinos 30-44

3%
71% 22% 7%
latinos 45-64

3%
67% 29% 4%
latinos 65 and older

1%
71% 24% 5%
all others

6%
60% 34% 6%
whites 30-44

17%
37% 55% 8%
whites 45-64

30%
34% 63% 3%
whites 65 and older

13%
39% 58% 3%
blacks 18-29

3%
83% 9% 8%
blacks 30-44

4%
87% 7% 6%
blacks 45-64

5%
90% 9% 1%
blacks 65 and older

1%
90% 9% 1%
latinos 18-29

2%
70% 24% 6%

education

clinton
trump
other/no answer
high school or less

18%
45% 51% 4%
some college

32%
43% 52% 5%
college graduate

32%
49% 45% 6%
postgraduate

18%
58% 37% 5%

are you a college graduate?

clinton
trump
other/no answer
yes

50%
52% 43% 5%
no

50%
44% 52% 4%

education and race

clinton
trump
other/no answer
white college graduates

37%
45% 49% 6%
whites no degree

34%
28% 67% 5%
non-whites college grads

13%
71% 23% 6%
non-whites no degree

16%
75% 20% 5%

education among whites by sex

clinton
trump
other/no answer
white college-grad women

20%
51% 45% 4%
white non-college women

17%
34% 62% 4%
white college-grad men

17%
39% 54% 7%
white non-college men

17%
23% 72% 5%
non-whites

29%
74% 21% 5%

income

clinton
trump
other/no answer
under $30,000

17%
53% 41% 6%
$30k-$49,999

19%
51% 42% 7%
$50k-$99,999

31%
46% 50% 4%
$100k-$199,999

24%
47% 48% 5%
$200k-$249,999

4%
48% 49% 3%
$250,000 or more

6%
46% 48% 6%

income

clinton
trump
other/no answer
under $50k

36%
52% 41% 7%
$50k or more

64%
47% 49% 4%

income

clinton
trump
other/no answer
under $100k

67%
49% 45% 6%
$100k or more

33%
47% 48% 5%

income

clinton
trump
other/no answer
under $50k

36%
52% 41% 7%
$50k-$100k

31%
46% 50% 4%
$100k or more

33%
47% 48% 5%

party id

clinton
trump
other/no answer
democrats

37%
89% 9% 2%
republicans

33%
7% 90% 3%
independents

31%
42% 48% 10%

party by gender

clinton
trump
other/no answer
democratic men

14%
87% 10% 3%
democratic women

23%
90% 8% 2%
republican men

17%
6% 90% 4%
republican women

16%
8% 89% 3%
independent men

17%
37% 51% 12%
independent women

14%
47% 43% 10%

ideology

clinton
trump
other/no answer
liberal

26%
84% 10% 6%
moderate

39%
52% 41% 7%
conservative

35%
15% 81% 4%

marital status

clinton
trump
other/no answer
married

58%
43% 53% 4%
unmarried

42%
55% 38% 7%

marital status by gender

clinton
trump
other/no answer
married men

29%
37% 58% 5%
married women

30%
49% 47% 4%
unmarried men

19%
46% 45% 9%
unmarried women

23%
62% 33% 5%

white born-again or evangelical christian?

clinton
trump
other/no answer
yes

26%
16% 81% 3%
no

74%
59% 35% 6%

religion

clinton
trump
other/no answer
protestant

27%
37% 60% 3%
catholic

23%
45% 52% 3%
mormon

1%
25% 61% 14%
other christian

24%
43% 55% 2%
jewish

3%
71% 24% 5%
muslim

1%
n/a n/a n/a
other religion

7%
58% 33% 9%
no religion

15%
68% 26% 6%

religion

clinton
trump
other/no answer
protestant

52%
39% 58% 3%
catholic

23%
45% 52% 3%
jewish

3%
71% 24% 5%
another religion

8%
62% 29% 9%
no religion

15%
68% 26% 6%

how often do you attend religious services?

clinton
trump
other/no answer
weekly or more

33%
40% 56% 4%
monthly

16%
46% 49% 5%
few times a year

29%
48% 47% 5%
never

22%
62% 31% 7%

how often do you attend religious services?

clinton
trump
other/no answer
monthly or more

49%
42% 54% 4%
less often than that

51%
54% 40% 6%

union household?

clinton
trump
other/no answer
yes

18%
51% 43% 6%
no

82%
46% 49% 5%

served in the u.s. military

clinton
trump
other/no answer
veterans

13%
34% 61% 5%
non-veterans

87%
50% 45% 5%

were you born a u.s. citizen?

clinton
trump
other/no answer
yes

91%
45% 50% 5%
no

9%
64% 31% 5%

first-time voter?

clinton
trump
other/no answer
yes

10%
56% 40% 4%
no

90%
47% 47% 6%

when did you decide presidential vote?

clinton
trump
other/no answer
last few days

8%
44% 46% 10%
last week

6%
38% 50% 12%
in october

12%
37% 51% 12%
in september

13%
46% 50% 4%
before september

60%
52% 45% 3%

when did you decide presidential vote?

clinton
trump
other/no answer
in the last week

13%
42% 47% 11%
before that

85%
49% 47% 4%

when did you decide presidential vote?

clinton
trump
other/no answer
in the last month

26%
39% 49% 12%
before that

73%
51% 46% 3%

opinion of presidential candidate you voted for

clinton
trump
other/no answer
strongly favor

41%
53% 42% 5%
have reservations

32%
48% 49% 3%
dislike opponents

25%
39% 51% 10%

most important issue facing the country

clinton
trump
other/no answer
foreign policy

13%
60% 34% 6%
immigration

13%
32% 64% 4%
economy

52%
52% 42% 6%
terrorism

18%
39% 57% 4%

which candidate quality mattered most?

clinton
trump
other/no answer
cares about me

15%
58% 35% 7%
can bring change

39%
14% 83% 3%
right experience

21%
90% 8% 2%
good judgment

20%
66% 26% 8%

illegal immigrants working in the u.s. should be:

clinton
trump
other/no answer
offered legal status

70%
60% 34% 6%
deported to home country

25%
14% 84% 2%

view of u.s. wall along the entire mexican border

clinton
trump
other/no answer
support

41%
10% 86% 4%
oppose

54%
76% 17% 7%

effect of international trade

clinton
trump
other/no answer
creates u.s. jobs

38%
59% 35% 6%
takes away u.s. jobs

42%
31% 65% 4%
does not affect jobs

11%
63% 30% 7%

how is the fight against isis going?

clinton
trump
other/no answer
very well

6%
85% 11% 4%
somewhat well

36%
70% 24% 6%
somewhat badly

28%
37% 56% 7%
very badly

24%
11% 85% 4%

how is the fight against isis going?

clinton
trump
other/no answer
well

42%
73% 23% 4%
badly

52%
25% 70% 5%

in your vote, were supreme court appointments:

clinton
trump
other/no answer
the most important factor

21%
41% 56% 3%
an important factor

48%
48% 47% 5%
a minor factor

14%
50% 41% 9%
not a factor at all

14%
55% 39% 6%

in your vote, were supreme court appointments:

clinton
trump
other/no answer
important

70%
46% 50% 4%
not important

28%
52% 40% 8%

does the country’s criminal justice system:

clinton
trump
other/no answer
treat all fairly

43%
23% 74% 3%
treat blacks unfairly

48%
71% 22% 7%

view on obamacare

clinton
trump
other/no answer
did not go far enough

30%
78% 18% 4%
was about right

18%
82% 10% 8%
went too far

47%
13% 83% 4%

feelings about the federal government

clinton
trump
other/no answer
enthusiastic

5%
78% 20% 2%
satisfied

24%
75% 20% 5%
dissatisfied

46%
45% 49% 6%
angry

23%
18% 77% 5%

feelings about the federal government

clinton
trump
other/no answer
enthusiastic/satisfied

29%
76% 20% 4%
dissatisfied/angry

69%
36% 58% 6%

opinion of government

clinton
trump
other/no answer
government should do more

45%
74% 22% 4%
government doing too much

50%
21% 73% 6%

opinion of barack obama as president

clinton
trump
other/no answer
strongly approve

33%
94% 4% 2%
somewhat approve

20%
69% 21% 10%
somewhat disapprove

12%
14% 76% 10%
strongly disapprove

33%
3% 95% 2%

opinion of barack obama as president

clinton
trump
other/no answer
approve

53%
84% 10% 6%
disapprove

45%
6% 90% 4%

should the next president:

clinton
trump
other/no answer
continue obama’s policies

28%
91% 5% 4%
be more conservative

48%
13% 83% 4%
be more liberal

17%
70% 23% 7%

opinion of hillary clinton

clinton
trump
other/no answer
favorable

44%
95% 3% 2%
unfavorable

54%
11% 82% 7%

opinion of donald trump

clinton
trump
other/no answer
favorable

38%
4% 95% 1%
unfavorable

60%
77% 15% 8%

opinion of clinton and trump

clinton
trump
other/no answer
both favorable

2%
n/a n/a n/a
only clinton favorable

41%
98% 1% 1%
only trump favorable

36%
1% 98% 1%
both unfavorable

18%
29% 49% 22%

is hillary clinton honest and trustworthy?

clinton
trump
other/no answer
yes

36%
94% 4% 2%
no

61%
20% 73% 7%

is donald trump honest and trustworthy?

clinton
trump
other/no answer
yes

33%
5% 94% 1%
no

63%
71% 21% 8%

which candidate is honest?

clinton
trump
other/no answer
both are

2%
n/a n/a n/a
only clinton is

34%
96% 1% 3%
only trump is

31%
1% 98% 1%
neither is

29%
40% 45% 15%

is clinton qualified to serve as president?

clinton
trump
other/no answer
yes

52%
86% 9% 5%
no

47%
5% 90% 5%

is trump qualified to serve as president?

clinton
trump
other/no answer
yes

38%
4% 94% 2%
no

60%
75% 18% 7%

who is qualified to serve as president?

clinton
trump
other/no answer
both are

5%
22% 70% 8%
only clinton is

46%
93% 2% 5%
only trump is

33%
1% 99% n/a
neither is

14%
15% 69% 16%

does clinton have the temperament to be president?

clinton
trump
other/no answer
yes

55%
82% 13% 5%
no

43%
5% 89% 6%

does trump have the temperament to be president?

clinton
trump
other/no answer
yes

35%
5% 94% 1%
no

63%
72% 20% 8%

which candidate has the right temperament?

clinton
trump
other/no answer
both do

6%
19% 77% 4%
only clinton does

49%
90% 5% 5%
only trump does

29%
2% 98% n/a
neither does

14%
12% 71% 17%

how would you feel if clinton wins?

clinton
trump
other/no answer
excited

17%
98% 1% 1%
optimistic

27%
92% 5% 3%
concerned

24%
18% 70% 12%
scared

29%
1% 95% 4%

how would you feel if clinton wins?

clinton
trump
other/no answer
positive

44%
94% 3% 3%
negative

53%
9% 84% 7%

how would you feel if trump wins?

clinton
trump
other/no answer
excited

13%
2% 97% 1%
optimistic

27%
3% 96% 1%
concerned

20%
54% 34% 12%
scared

36%
92% 2% 6%

how would you feel if trump wins?

clinton
trump
other/no answer
positive

40%
3% 96% 1%
negative

57%
78% 14% 8%

does clinton’s use of private email bother you:

clinton
trump
other/no answer
a lot

45%
7% 87% 6%
some

17%
68% 26% 6%
not much

17%
88% 7% 5%
not at all

19%
92% 5% 3%

does clinton’s use of private email bother you?

clinton
trump
other/no answer
yes

63%
24% 70% 6%
no

36%
90% 6% 4%

does donald trump’s treatment of women bother you:

clinton
trump
other/no answer
a lot

50%
83% 11% 6%
some

20%
19% 75% 6%
not much

13%
8% 88% 4%
not at all

16%
10% 87% 3%

does donald trump’s treatment of women bother you?

clinton
trump
other/no answer
yes

70%
65% 29% 6%
no

29%
9% 87% 4%

who would better handle the economy?

clinton
trump
other/no answer
clinton

46%
96% 1% 3%
trump

49%
3% 94% 3%

who would better handle foreign policy?

clinton
trump
other/no answer
clinton

52%
86% 7% 7%
trump

43%
2% 96% 2%

who would be a better commander in chief?

clinton
trump
other/no answer
clinton

49%
94% 2% 4%
trump

46%
1% 96% 3%

opinion of the democratic party

clinton
trump
other/no answer
favorable

47%
88% 8% 4%
unfavorable

49%
9% 85% 6%

opinion of the republican party

clinton
trump
other/no answer
favorable

40%
11% 86% 3%
unfavorable

55%
73% 20% 7%

condition of national economy

clinton
trump
other/no answer
excellent

3%
83% 16% 1%
good

33%
76% 19% 5%
not good

41%
39% 55% 6%
poor

21%
15% 79% 6%

condition of national economy

clinton
trump
other/no answer
good

36%
77% 18% 5%
poor

63%
31% 63% 6%

financial situation compared to four years ago:

clinton
trump
other/no answer
better today

31%
72% 24% 4%
worse today

27%
19% 78% 3%
about the same

41%
46% 46% 8%

direction of the country

clinton
trump
other/no answer
right direction

33%
90% 8% 2%
wrong track

62%
25% 69% 6%

life for the next generation of americans will be:

clinton
trump
other/no answer
better than today

37%
59% 38% 3%
worse than today

34%
31% 63% 6%
about the same

24%
54% 39% 7%

vote for president in a two-way race

clinton
trump
other/no answer
clinton

47%
97% 1% 2%
trump

47%
1% 97% 2%
would not vote

5%
16% 21% 63%

how confident are you in the vote count?

clinton
trump
other/no answer
very confident

47%
68% 28% 4%
somewhat confident

37%
33% 62% 5%
not very confident

11%
25% 69% 6%
not at all confident

5%
26% 58% 16%

are you confident in the vote count?

clinton
trump
other/no answer
confident

83%
52% 43% 5%
not confident

15%
25% 66% 9%

are you gay, lesbian, bisexual or transgender?

clinton
trump
other/no answer
yes

5%
78% 14% 8%
no

95%
47% 48% 5%

importance of debates to your vote

clinton
trump
other/no answer
most important factor

26%
51% 47% 2%
an important factor

38%
50% 46% 4%
a minor factor

19%
37% 60% 3%
not a factor

11%
42% 51% 7%

importance of debates to your vote

clinton
trump
other/no answer
important

64%
50% 47% 3%
not important

30%
38% 57% 5%

were debates a factor in your vote?

clinton
trump
other/no answer
yes

82%
47% 50% 3%
no

11%
42% 51% 7%

vote for u.s. house

clinton
trump
other/no answer
democratic candidate

49%
89% 6% 5%
republican candidate

49%
7% 89% 4%

area type

clinton
trump
other/no answer
urban area

34%
59% 35% 6%
suburban area

49%
45% 50% 5%
rural area

17%
34% 62% 4%
back to top

Notes

  • All times ET.
  • Not all candidates are listed.
  • Some states have multiple poll closing times.
  • CNN will broadcast a projected winner only after an extensive review of data from a number of sources.
  • “Party change” denotes a race where the 2016 projected winner is from a different party than the previous winner or incumbent.
  • Maine and Nebraska allow electoral votes to be split. In Maine, two of four electoral votes go to the statewide winner and one electoral vote goes to the winner in each of the two congressional districts. In Nebraska, two of five electoral votes go to the winner of the statewide vote. One electoral vote goes to the winner in each of the Nebraska’s three congressional districts.

At Least We Got 4

Recreational marijuana will be legal in Massachusetts as of December 15. Legalization also passed in California and Nevada.

Colorado passed a Death with Dignity referendum.

Whether or not Trump follows through on his campaign promises remains to be seen.

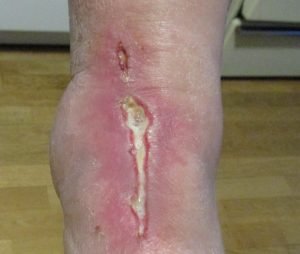
img_0485

Had a good session yesterday at the Wound Center. DVH temporarily doubled the dose of HCTZ.

Honestly, I’m relieved that my world view has been reinforced by this election. If Hillary Clinton had won, then I’d have nothing to blame but my own shortcomings for my failures.

Now, it’s been proven that misogyny, selfishness and irrationality beat open-mindedness, generosity and logic every time. It’s been proven that greed and lying will prevail, and that the formula for success in America – work hard, think big, have a dream – is a fantasy.

I would have been very surprised if the opposite had held true. Hillary Clinton’s personal story, like Barack Obama’s, is so improbable that if she had succeeded, it would have given false hope to the rest of us.

Wound Hurts

We got through Sunday chores okay: laundry, transfer station, changed sheets.

Kitty slept here for a few hours.

It was raining when we were at the transfer station, so I mentioned a reward. Ron treated us to muffins at Panera.

Grilled burgers and salad for supper.

IKEA

Last time we were in IKEA was March 2015, when we bought the components of a wall unit for the second bedroom.

We went back yesterday for what was touted as a special event.  Unfortunately, the timing didn’t work out for us, although we did get free coffee and candy samples.

We brought home paper napkins, cereal, cardamom crisp rolls, jams, a jar of herring, candy, glögg, a non-BPA food storage set, measuring cups, white wine glasses, a lampshade, a kitchen utility container and of course, cinnamon rolls.

Ron bought a pair of sneakers at the New Balance factory outlet.

We got back in time for Ron to give Robert a lift home from work.

Ron put up the second shower grip bar; I caulked it.  Also trimmed the bottom of the vertical blinds in the kitchen.  Smokey came by around 5:30 and we had to send him home, which I hated to do.

Soup and salad for supper.

Turned the clocks back this morning.